Campbell Rinker uses Perceptual Mapping to help organizations understand how they are appear as unique among the many options consumers enjoy. These maps describe relationships among differentiating traits (e.g. organizational qualities). They help identify where the audience “sees,” or perceives organizations that are similar to each other in the context of those distinct traits. They can also describe where audiences see organizations as distinct from each other.
In a perceptual map, traits are plotted as lines or “vectors” in two dimensions. (Actually, the lines exist in 3-D space, and we do our best to present them flattened out!) At the same time, the organizations being tested are isolated as specific points within that space. (The placement of these lines and points is guided by a statistical technique called discriminate-function analysis). Longer vectors mean that a trait has a greater ability to distinguish among the organizations mapped, while shorter lines describe less impact.
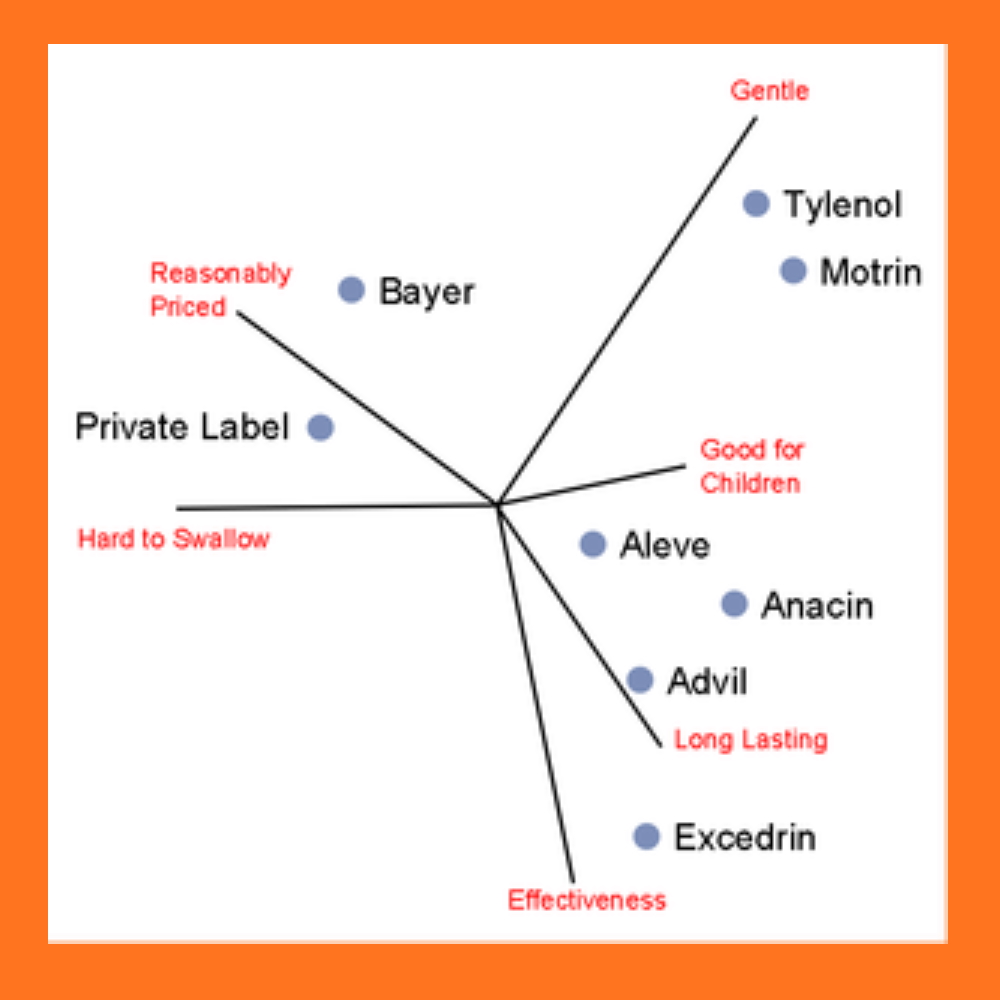
This is a representative sample of a perceptual map. The red labels are descriptors chosen by survey respondents to identify product qualities. The gray dots represent the products themselves, arrayed in three-dimensional space. Our maps typically display organizations alongside peer entities.
With such a map, organizations can understand how to create messages that resonate with their audience, position themselves uniquely in a way that resonates with their target audience, and distinguish themselves from peer organizations that might actually share quite similar purposes. Or by replica rolex air king watches